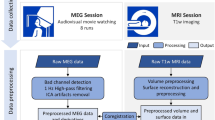
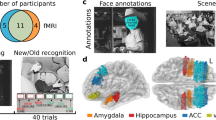
In this work, we present a dataset that combines functional magnetic imaging (fMRI) and electroencephalography (EEG) to use as a resource for understanding human brain function in these two imaging modalities. The dataset can also be used for optimizing preprocessing methods for simultaneously collected imaging data. The dataset includes simultaneously collected recordings from 22 individuals (ages: 23–51) across various visual and naturalistic stimuli. In addition, physiological, eye tracking, electrocardiography, and cognitive and behavioral data were collected along with this neuroimaging data. Visual tasks include a flickering checkerboard collected outside and inside the MRI scanner (EEG-only) and simultaneous EEG-fMRI recordings. Simultaneous recordings include rest, the visual paradigm Inscapes, and several short video movies representing naturalistic stimuli. Raw and preprocessed data are openly available to download. We present this dataset as part of an effort to provide open-access data to increase the opportunity for discoveries and understanding of the human brain and evaluate the correlation between electrical brain activity and blood oxygen level-dependent (BOLD) signals.

Simultaneous collection of electroencephalography (EEG) and functional magnetic resonance imaging (fMRI) data is an attractive approach to imaging as it combines the high spatial resolution of fMRI with the high temporal resolution of EEG. Combining modalities allows researchers to integrate spatial and temporal information while overcoming the limitations of a single imaging modality 1,2 . Nevertheless, collecting multimodal data simultaneously requires specific expertise, and researchers must overcome various technical challenges to successfully collect data. Such challenges may limit its broader usage in the research community.
There are several technical challenges encountered when collecting imaging modalities simultaneously. With EEG, the main challenge is due to various sources of noise that impact the recorded signal. Gradient artifact is the most significant source of noise in simultaneous recordings, caused by the magnetic field gradients during fMRI acquisition, which induce current into EEG electrodes 3 . Another noise source is the ballistocardiogram (BCG) signal, which captures the ballistic forces of blood in the cardiac cycle 4,5 . The BCG artifact arises from the pulsation of arteries in the scalp that causes movement in EEG electrodes and generates voltage. The BCG artifact is more pronounced in a strong magnetic field and increases with field strength 6 . In addition to gradient and BCG artifacts, other noise sources include the MRI helium compressor 7 , eye blinks 8 , head movement, and respiratory artifacts 9 . Additionally, while collecting fMRI data, one of the main issues is patient discomfort while wearing the EEG cap in the scanner, which can cause increased head motion. Likewise, preparation time for collecting both datasets can also increase participant burden. Collecting simultaneous fMRI and EEG requires overcoming a variety of technical challenges but also needs advanced preprocessing techniques to overcome these unavoidable artifacts and produce a cleaner signal. In this paper, we detail how we addressed various technical challenges encountered when recording simultaneous EEG-fMRI including strategies to improve data quality.
For this dataset, most of the tasks performed by the participants are naturalistic viewing tasks. Naturalistic stimuli represent paradigms considered more complex and dynamic than task-based stimuli 10,11 . Naturalistic viewing provides more physiologically relevant conditions and produces closer to real-world brain responses 12,13,14 . Naturalistic stimuli also contain narrative structure and provide context that reflects real-life experiences 14,15 . Moreover, movies have been found to have high intersubject correlation and reliability 16,17 , hold subjects’ attention 18 , and improves compliance related to motion and wakefulness 19 . Naturalistic movies are also an ideal stimulus for multimodal data sets and may be useful in linking responses across levels 20,21 and species 22 .
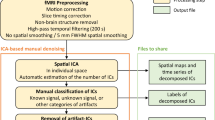
In this manuscript, we present a dataset collected at the Nathan S. Kline Institute for Psychiatric Research (NKI) in Orangeburg, NY, representing a study using simultaneously collected EEG and fMRI in healthy adults. The dataset contains multiple task conditions across two scans, including a visual task, resting state, and naturalistic stimuli. We also present quality control metrics for both modalities and describe preprocessing steps to clean up the EEG data. Lastly, we openly share these raw and processed data through the International Neuroimaging Data-Sharing Initiative (INDI) along with preprocessing code available on GitHub.
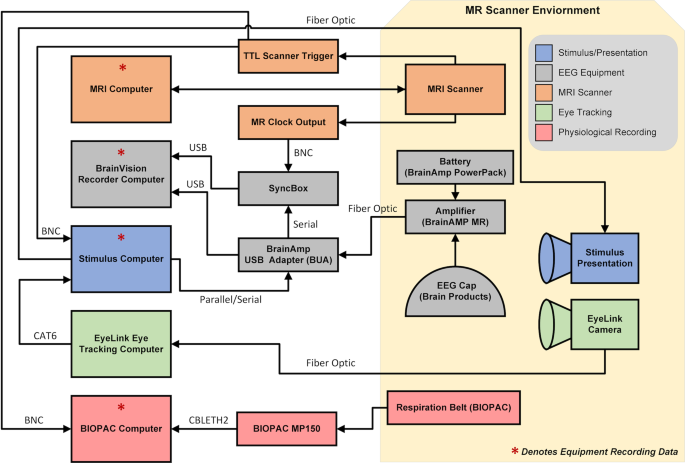
Simultaneous EEG-fMRI was collected in twenty-two adults (ages 23–51 years; mean age: 36.8; 50% male) recruited from the Rockland County, NY community. Participants enrolled in this study have no history of psychiatric or neurological illnesses. All imaging was collected using a 3 T Siemens TrioTim equipped with a 12-channel head coil. EEG data were collected using an MR-compatible system by Brain Products consisting of the BrainCap MR with 64 channels, two 32-channel BrainAmp MR amplifiers, and a PowerPack battery. Cortical electrodes were arranged according to the international 10–20 system. Inside the scanner, eye tracking was collected in the left eye using the EyeLink 1000 Plus.
Participants attended two sessions between 2 and 354 days between scans (time between scans, mean: 38.2 days; median: 11 days); see Table 1 for the breakdown of data acquired during sessions. The scanning protocol consisted of three recording settings. The “Outside” setting was an EEG recording collected outside the MRI scanner in a non-shielded room; the “Scanner OFF” setting consisted of EEG recordings collected inside the static field of the MRI scanner while the scanner was off; the “Scanner ON” setting consisted the simultaneous EEG and fMRI recordings. All research performed was approved by NKIs Institutional Review Board (IRB# 941632). Prior to the experiment, written informed consent was obtained from all participants. Participants also provided demographic information and behavioral data, including information on their last month of sleep (Pittsburgh Sleep Study) 23 , the amount of sleep they had the previous night, and their caffeine intake before the scan session.
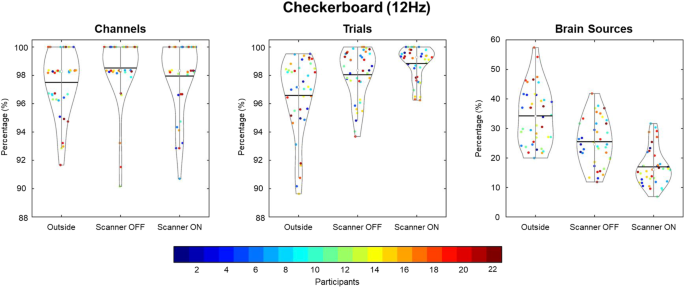
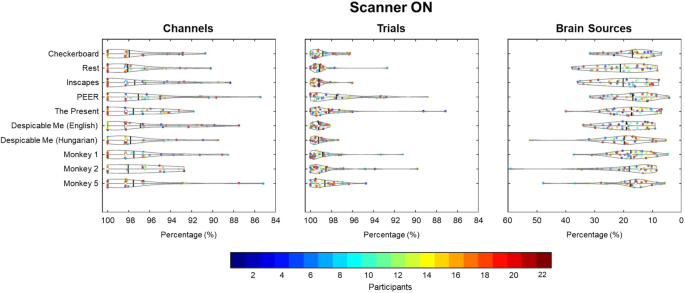
Three quality assessment metrics were computed for each raw EEG dataset: percent of “good” channels, percent of “good” trials, and the number of independent components (ICs) related to brain source activity as a percentage of the total number of ICs. As shown in Fig. 3, data quality was high across all subjects for the percentage of good channels and trials for the checkerboard task. Although the data quality was highest in the Outside setting, high percentages were found for channels and trials in the Scanner OFF and Scanner ON settings. Similarly, as seen in Fig. 4, the percentage of good channels and trials was high across tasks, denoting the stability of data quality during the scan session. The percent of putative brain sources based on ICs classification was lower for the Scanner ON setting compared to the other two settings. Due to the increase in noise sources in the Scanner OFF (e.g., pulse artifact) and Scanner ON (e.g., gradient artifact) settings, the percentage of ICs related to brain sources is expected to decrease. As shown in Fig. 4, the quality of the EEG data is stable across scan settings.
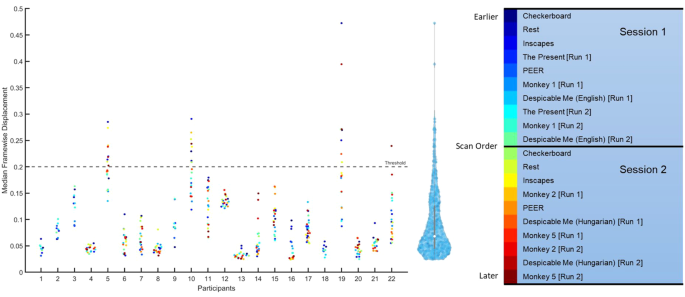
To assess the quality of fMRI data, median framewise displacement (FD) was measured for all scans. As shown in Fig. 5, the median FD was for every fMRI scan; scans with a value above 0.2 were considered high motion. To determine if there was an ordering effect, scan sessions were color coded to determine if participants moved earlier or later in the scan. Most subject data were below the 0.2 threshold (93% of scans), and there was no pattern of ordering across participants.
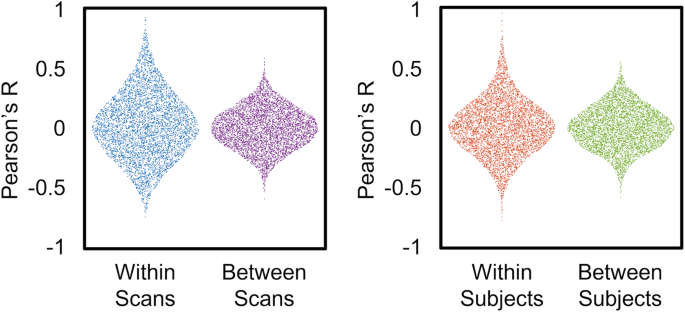
For the checkerboard experiment, we looked at the correlation between ROIs within and between subjects and across scans (Fig. 6). The distributions for within-scan and within subjects showed a broader distribution of values, with higher correlations for within-scan and within subject distributions.
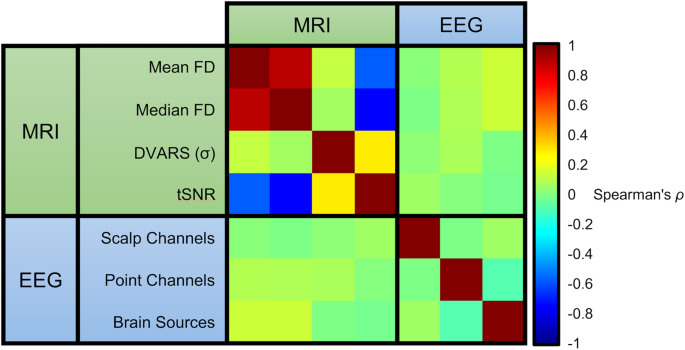
Values for EEG and MRI data were compared within and between modalities across several quality metrics: mean FD (framewise displacement), median FD, DVARS (temporal derivative of time courses), and tSNR (temporal signal-to-noise ratio) for MRI; channels, trials, and brain sources for EEG (Fig. 7). Using Spearman’s ρ between each modality, shows a strong positive correlation between mean and median FD, and a strong negative correlation between FD measures and tSNR. A weak correlation was found between DVARS and tSNR, but no association was found with DVARS and other measures. For EEG measures, there was no correlation between the different quality measures. Moreover, there was no correlation between quality measures between imaging modalities.
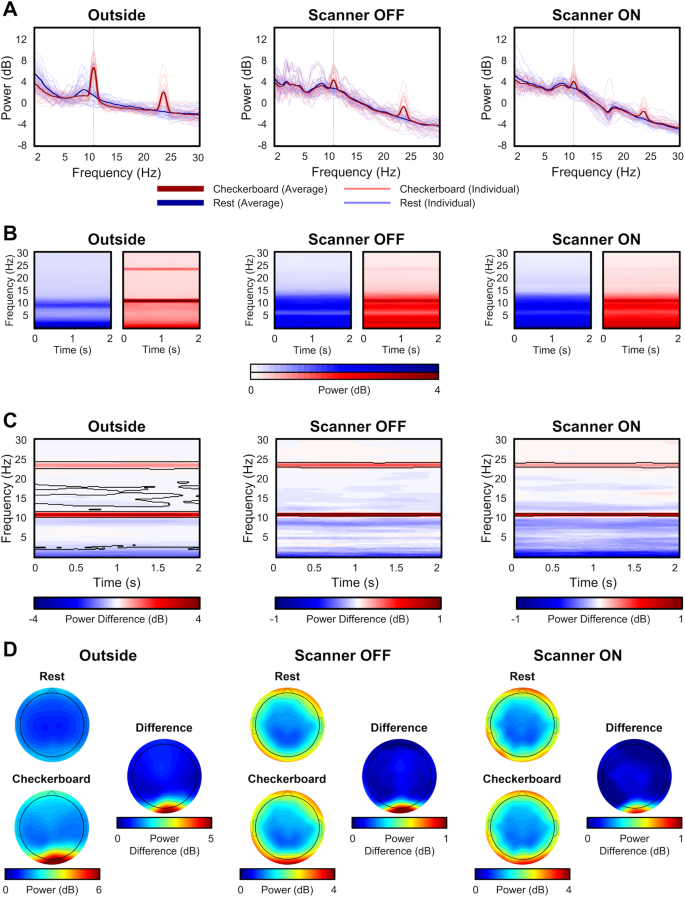
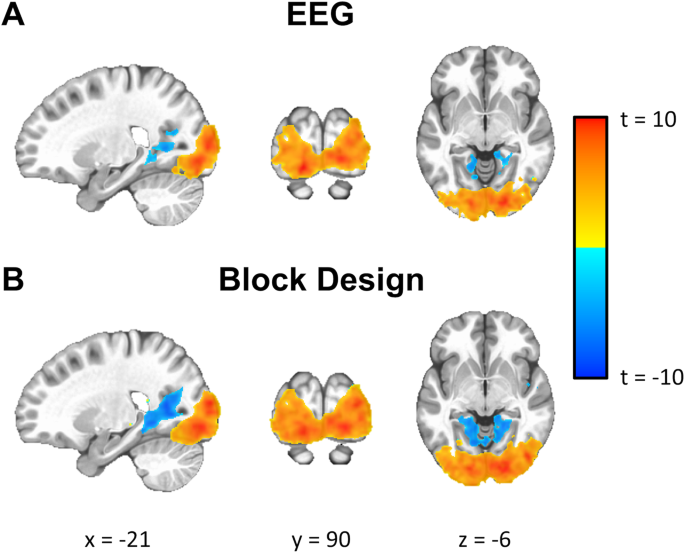
As a test for multimodal data integration, we evaluated whether we could use the EEG signal to predict the hemodynamic response in the fMRI data. Specifically, after preprocessing, the EEG signal from Oz signal was averaged across participants for the checkerboard experiment. This signal was then bandpass filtered (20th order IIR filter between 11 Hz and 13 Hz), modulated, and convolved with an ideal hemodynamic response function (using a gamma variate function). This signal was used as a regressor for each participant to map out the BOLD activity. A one-sample t-test was performed to calculate a group activity map (Fig. 8A). For comparison purposes, a regressor based on an ideal block design convoluted a gamma variate function was also calculated to look at the group-level activity (Fig. 8B). Activity maps shown in Fig. 8 indicate that both approaches generate a similar level of activity in the occipital lobe.
Collecting EEG and fMRI simultaneously requires several methodological considerations. While EEG and fMRI have a long-established history, collecting EEG inside the MRI scanner is challenging for several technical reasons. The main problem encountered when collecting a functional recording is the generation of artifacts from various sources. The main artifact arises from the gradient artifact generated during echo-planar imaging (EPI), which induces changes in the magnetic field 55 . Another source of noise arises from the scanner environment. While not a problem in all scanners, vibrations from the helium compressor in Siemens Trio and Verio scanners introduce artifacts into the EEG signal 56 ; these vibrations induce non-stationary artifacts that contaminate the EEG signal. Yet another source of noise is caused by the pulsation of arteries in the scalp that cause movement in EEG electrodes and generation voltage. The ballistocardiogram (BCG) signal captures the ballistic forces of blood in the cardiac cycle 4,5 and becomes more pronounced as the magnetic field strength increases 6 . In addition to a more pronounced signal, the ECG signal can impact data collection and preprocessing. In some cases, the pronounced ECG signal leads to saturation of the signal during the MRI scan sequence. Consequently, this saturation causes signal clipping that impedes QRS detection and pulse artifact removal methods during preprocessing. In this data release, there are occasions of signal clipping of the ECG channel. For participants where QRS detection of the ECG channel failed, one method used in this study was to perform QRS detection on every EEG channel and select the channel containing the mode of the detected QRS complexes. From this channel, the median template is created and applied across channels for pulse artifact removal.
To address these numerous sources of noise, there are also techniques. Gradient artifacts can be minimized by modifying the configuration or layout of EEG leads 57 or placement of the head in the coil 58 . To remove the gradient field artifact, we use the MR clock to record the scanner trigger at every TR 59,60 . Using a template artifact subtraction method 61 , the gradient artifact is recorded at each TR onset and averaged to create a template. The template is then subtracted from the signal to produce a clean signal. In this study, we used the MRIB plug-in for EEGLAB, provided by the University of Oxford Centre for Functional MRI of the Brain (FMRIB), to regress the MRI gradient artifact 37,38 . For noise induced by the helium compressor, there are methods for recording and regressing this motion induced artifact 7,62 ; however, in our experiments, the simplest method for removing this artifact was to turn off the helium compressor during simultaneous recordings. While there is a risk of helium boiling off as the temperature rises in the scanner, this can be addressed by having shorter scan sessions. In our study, the temperature of the cooling system did not fluctuate, which would impact cryogen loss. While shorter scans are ideal, we collected data for upwards of 2 hours without issue.
Another factor found to impact EEG data quality was signal clipping, which often appears in the ECG channel during simultaneous recordings. In our simultaneous EEG-fMRI recordings, cable and amplifier placement inside the scanner affected EEG data quality. For cable placement, several factors must be taken into consideration. When scanning, researchers must ensure their setup minimizes loops, cables should run along the center of the bore, and the connected amplifier should be placed at the center of the bore to ensure better data quality 55 . Excessive bends or loops in wires can induce currents in the cables, thus introducing artifacts into the EEG signal. Another way to reduce artifacts is to reduce cable length between the EEG cap and connected amplifiers. All major scanner vendors offer head coils that are designed with a channel for EEG cables that lie directly above a participant’s head 63 . In addition, cables that are bundled produce fewer artifacts than ribboned cables 64 . In our experiments, the head coil did not contain a channel for EEG cables and a ribboned cable was used to connect the cap and amplifier. To reduce artifacts, EEG cables were run through the head coil above the participant’s head and taped along the center of the bore to minimize movement and to ensure an optimal position in the scanner.
Code for presenting task stimuli and naturalistic stimuli, along with code to preprocess EEG and fMRI imaging data, is available on GitHub (https://github.com/NathanKlineInstitute/NATVIEW_EEGFMRI). Additionally, the videos used for naturalistic stimuli will also be made available through the GitHub repository.
We would like to acknowledge Raj Sangoi and Caixia Hu for providing their technical support and expertise in developing the scanning protocol for data collection. We would also like to acknowledge Mark Higger for his contributions developing code for the EEG preprocessing pipeline. Primary support for the work is provided by the BRAIN Initiative (R01MH111439) and CONTE center (P50MH109429), Rockland Sample (R01MH124045) grants from the NIH. Data hosting is supported by AWS’s Open Data program.